| - Ammonia (NH3 + NH4+; as N), FIL, DA - |
| Lab: NWQL, PCode: 00608, MCode: SHC02 |
| Analysis Dates: 10/01/08 through 09/28/23 |
| Open Data Set |
| Boxplot Description |
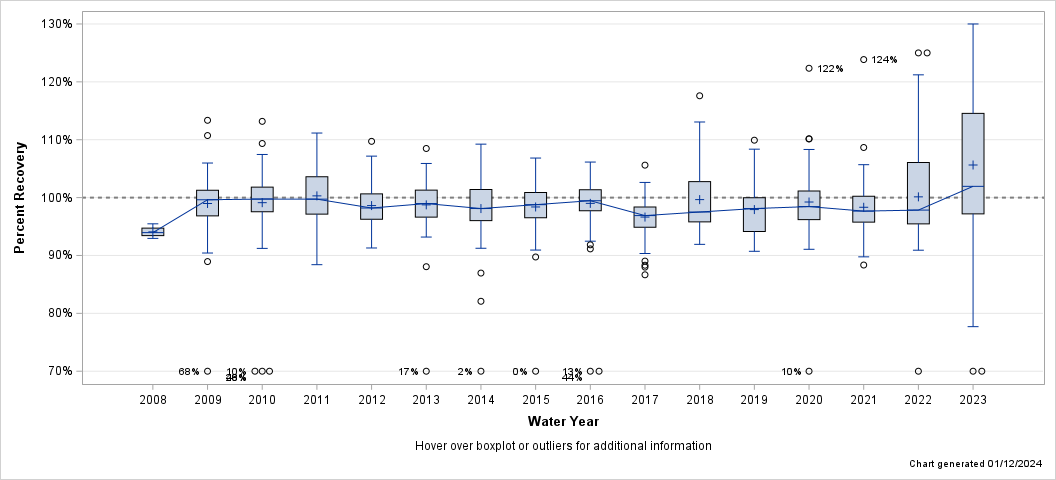
| - Ammonia (NH3 + NH4+; as N), FIL, DA - |
| Lab: NWQL, PCode: 00608, MCode: SHC02 |
| Analysis Dates: 10/01/08 through 09/28/23 |
| Open Data Set |
| Boxplot Description |

| Percent Recovery Statistics for Ammonia (NH3 + NH4+; as N), FIL, DA |
| Analyte | Parm-meth Code | Water Year | # of Samples |
25th Pctl | 50th Pctl (Median) |
75th Pctl |
|---|---|---|---|---|---|---|
| Ammonia (NH3 + NH4+; as N), FIL, DA | 00608SHC02 | 2008 | 4 | 93.4% | 93.9% | 94.7% |
| 2009 | 125 | 96.8% | 99.6% | 101.3% | ||
| 2010 | 144 | 97.6% | 99.7% | 101.8% | ||
| 2011 | 138 | 97.1% | 99.7% | 103.6% | ||
| 2012 | 140 | 96.3% | 98.2% | 100.6% | ||
| 2013 | 108 | 96.6% | 99.0% | 101.3% | ||
| 2014 | 78 | 96.0% | 98.1% | 101.4% | ||
| 2015 | 96 | 96.5% | 98.8% | 100.9% | ||
| 2016 | 96 | 97.7% | 99.5% | 101.4% | ||
| 2017 | 87 | 94.9% | 96.9% | 98.4% | ||
| 2018 | 89 | 95.8% | 97.5% | 102.8% | ||
| 2019 | 82 | 94.1% | 98.1% | 100.0% | ||
| 2020 | 95 | 96.2% | 98.4% | 101.1% | ||
| 2021 | 96 | 95.8% | 97.7% | 100.2% | ||
| 2022 | 69 | 95.5% | 97.8% | 106.1% | ||
| 2023 | 80 | 97.2% | 101.9% | 114.6% |
| Hover over boxplot or outliers for additional information |
| Chart generated 01/12/2024 |
| - Ammonia (NH3 + NH4+; as N), UNF, CFA, Acidified - |
| Lab: NWQL, PCode: 00610, MCode: CL017 |
| Analysis Dates: 10/14/08 through 08/04/23 |
| Open Data Set |
| Boxplot Description |
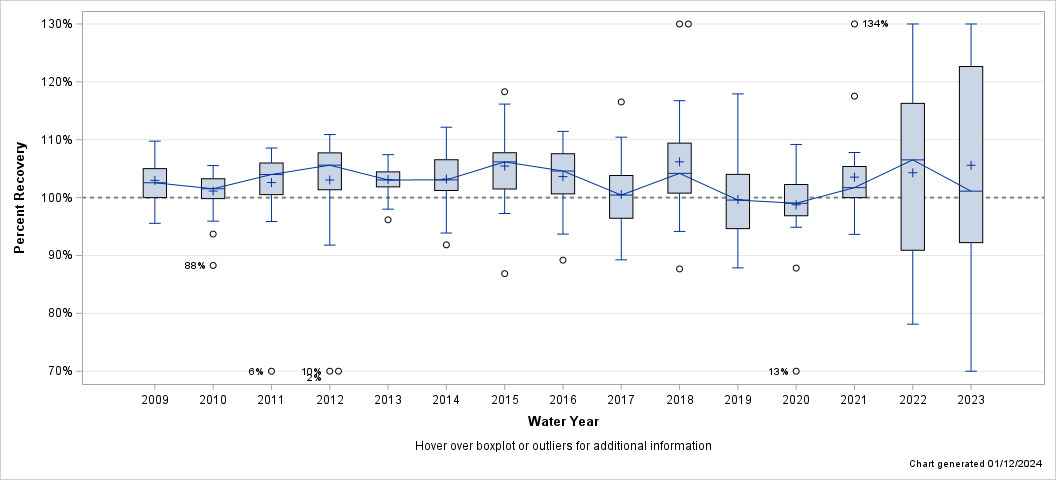
| Percent Recovery Statistics for Ammonia (NH3 + NH4+; as N), UNF, CFA, Acidified |
| Analyte | Parm-meth Code | Water Year | # of Samples |
25th Pctl | 50th Pctl (Median) |
75th Pctl |
|---|---|---|---|---|---|---|
| Ammonia (NH3 + NH4+; as N), UNF, CFA, Acidified | 00610CL017 | 2009 | 40 | 100.0% | 102.6% | 105.0% |
| 2010 | 48 | 99.8% | 101.5% | 103.3% | ||
| 2011 | 48 | 100.5% | 104.0% | 106.0% | ||
| 2012 | 48 | 101.3% | 105.6% | 107.7% | ||
| 2013 | 36 | 101.9% | 103.0% | 104.4% | ||
| 2014 | 17 | 101.2% | 103.1% | 106.5% | ||
| 2015 | 24 | 101.5% | 106.2% | 107.7% | ||
| 2016 | 24 | 100.6% | 104.6% | 107.6% | ||
| 2017 | 24 | 96.4% | 100.4% | 103.8% | ||
| 2018 | 20 | 100.8% | 104.2% | 109.4% | ||
| 2019 | 20 | 94.6% | 99.6% | 104.0% | ||
| 2020 | 24 | 96.9% | 99.0% | 102.3% | ||
| 2021 | 24 | 100.0% | 101.7% | 105.4% | ||
| 2022 | 18 | 90.9% | 106.5% | 116.3% | ||
| 2023 | 17 | 92.2% | 101.1% | 122.6% |
| Hover over boxplot or outliers for additional information |
| Chart generated 01/12/2024 |
| - Kjeldahl Nitrogen (NH3+NH4 plus org N; as N), FIL, CFA - |
| Lab: NWQL, PCode: 00623, MCode: KJ002 |
| Analysis Dates: 10/01/08 through 09/26/23 |
| Open Data Set |
| Boxplot Description |
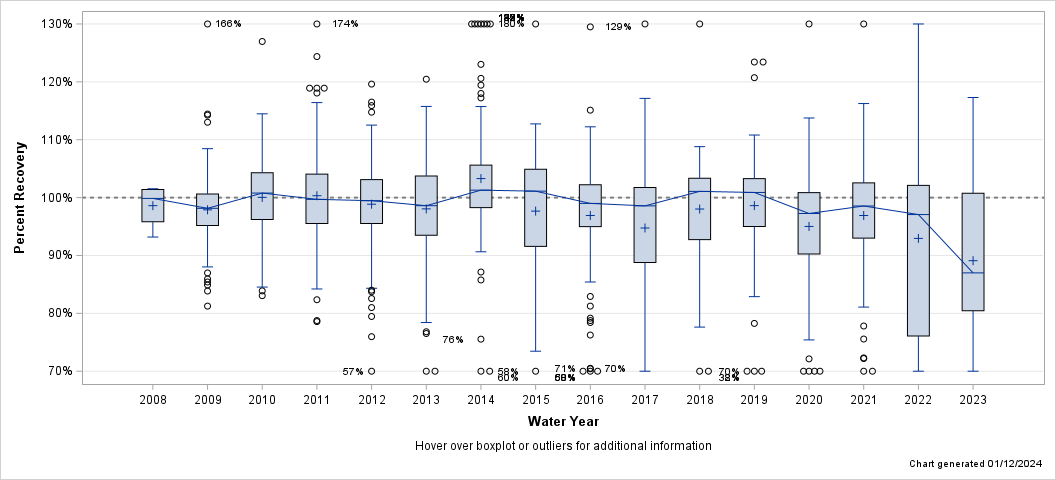
| Percent Recovery Statistics for Kjeldahl Nitrogen (NH3+NH4 plus org N; as N), FIL, CFA |
| Analyte | Parm-meth Code | Water Year | # of Samples |
25th Pctl | 50th Pctl (Median) |
75th Pctl |
|---|---|---|---|---|---|---|
| Kjeldahl Nitrogen (NH3+NH4 plus org N; as N), FIL, CFA | 00623KJ002 | 2008 | 4 | 95.8% | 99.9% | 101.4% |
| 2009 | 124 | 95.2% | 98.1% | 100.6% | ||
| 2010 | 144 | 96.2% | 100.8% | 104.3% | ||
| 2011 | 132 | 95.5% | 99.7% | 104.1% | ||
| 2012 | 134 | 95.5% | 99.5% | 103.1% | ||
| 2013 | 103 | 93.5% | 98.6% | 103.7% | ||
| 2014 | 82 | 98.3% | 101.3% | 105.6% | ||
| 2015 | 90 | 91.6% | 101.1% | 104.9% | ||
| 2016 | 90 | 95.0% | 99.0% | 102.2% | ||
| 2017 | 77 | 88.8% | 98.6% | 101.7% | ||
| 2018 | 83 | 92.7% | 101.1% | 103.3% | ||
| 2019 | 80 | 95.0% | 100.9% | 103.3% | ||
| 2020 | 74 | 90.3% | 97.3% | 100.8% | ||
| 2021 | 74 | 93.0% | 98.5% | 102.5% | ||
| 2022 | 54 | 76.1% | 97.1% | 102.1% | ||
| 2023 | 82 | 80.5% | 87.0% | 100.7% |
| Hover over boxplot or outliers for additional information |
| Chart generated 01/12/2024 |
| - Kjeldahl Nitrogen (NH3+NH4 plus org N; as N), UNF, CFA, ACD - |
| Lab: NWQL, PCode: 00625, MCode: KJ008 |
| Analysis Dates: 10/01/08 through 09/27/23 |
| Open Data Set |
| Boxplot Description |
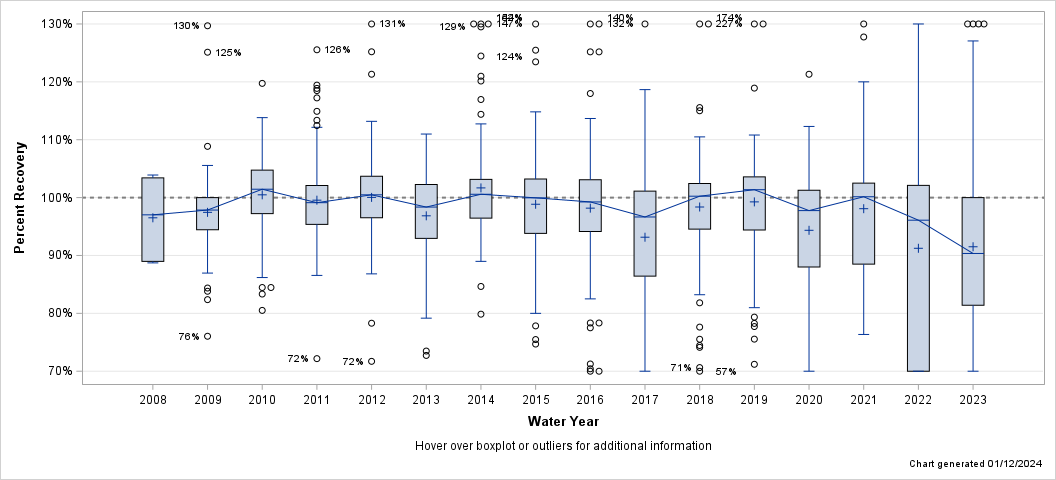
| Percent Recovery Statistics for Kjeldahl Nitrogen (NH3+NH4 plus org N; as N), UNF, CFA, ACD |
| Analyte | Parm-meth Code | Water Year | # of Samples |
25th Pctl | 50th Pctl (Median) |
75th Pctl |
|---|---|---|---|---|---|---|
| Kjeldahl Nitrogen (NH3+NH4 plus org N; as N), UNF, CFA, ACD | 00625KJ008 | 2008 | 6 | 89.0% | 97.0% | 103.4% |
| 2009 | 124 | 94.4% | 97.8% | 100.0% | ||
| 2010 | 144 | 97.2% | 101.4% | 104.7% | ||
| 2011 | 137 | 95.4% | 99.1% | 102.1% | ||
| 2012 | 134 | 96.5% | 100.5% | 103.7% | ||
| 2013 | 103 | 93.0% | 98.4% | 102.3% | ||
| 2014 | 84 | 96.4% | 100.6% | 103.1% | ||
| 2015 | 90 | 93.8% | 100.0% | 103.2% | ||
| 2016 | 90 | 94.1% | 99.2% | 103.1% | ||
| 2017 | 77 | 86.4% | 96.7% | 101.1% | ||
| 2018 | 83 | 94.5% | 100.2% | 102.4% | ||
| 2019 | 80 | 94.4% | 101.4% | 103.6% | ||
| 2020 | 73 | 88.0% | 97.8% | 101.3% | ||
| 2021 | 74 | 88.5% | 100.1% | 102.5% | ||
| 2022 | 55 | 70.0% | 96.1% | 102.1% | ||
| 2023 | 83 | 81.4% | 90.3% | 100.0% |
| Hover over boxplot or outliers for additional information |
| Chart generated 01/12/2024 |
| - Nitrate plus Nitrite (as N), FIL, COL - |
| Lab: NWQL, PCode: 00631, MCode: CL048 |
| Analysis Dates: 10/01/08 through 10/17/11 |
| Open Data Set |
| Boxplot Description |
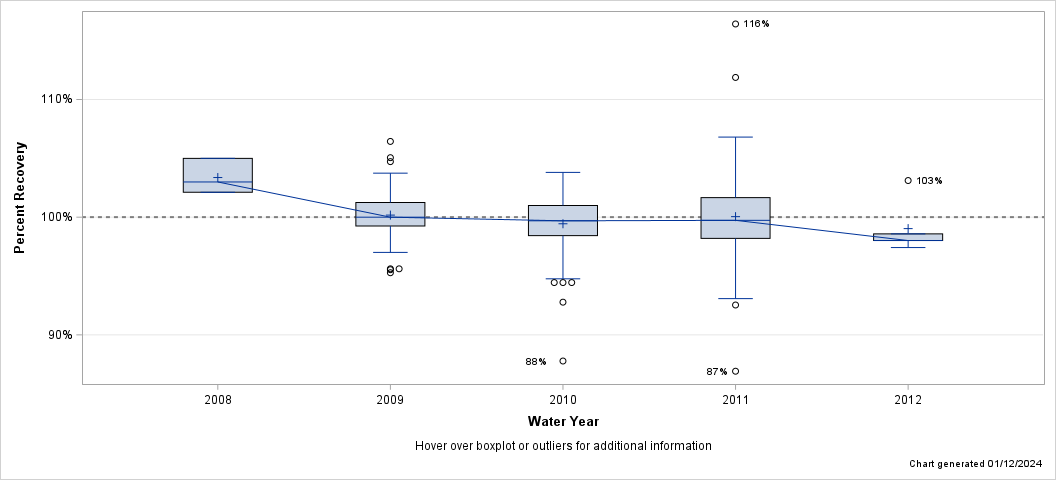
| Percent Recovery Statistics for Nitrate plus Nitrite (as N), FIL, COL |
| Analyte | Parm-meth Code | Water Year | # of Samples |
25th Pctl | 50th Pctl (Median) |
75th Pctl |
|---|---|---|---|---|---|---|
| Nitrate plus Nitrite (as N), FIL, COL | 00631CL048 | 2008 | 3 | 102.1% | 103.0% | 105.0% |
| 2009 | 125 | 99.3% | 100.0% | 101.2% | ||
| 2010 | 144 | 98.4% | 99.7% | 101.0% | ||
| 2011 | 138 | 98.2% | 99.7% | 101.7% | ||
| 2012 | 5 | 98.0% | 98.0% | 98.6% |
| Hover over boxplot or outliers for additional information |
| Chart generated 01/12/2024 |
| - Nitrate plus Nitrite (as N), FIL, COL, LL - |
| Lab: NWQL, PCode: 00631, MCode: CL050 |
| Analysis Dates: 10/07/08 through 10/18/11 |
| Open Data Set |
| Boxplot Description |
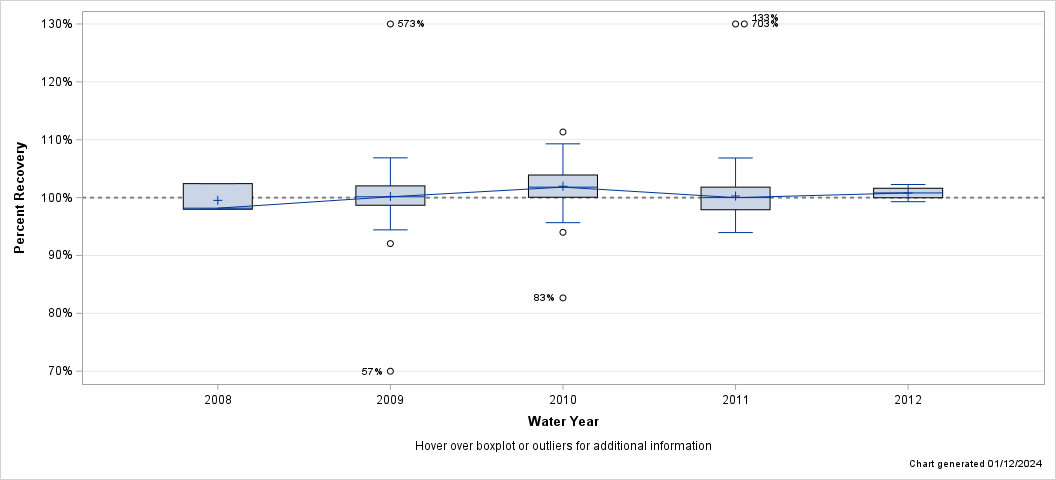
| Percent Recovery Statistics for Nitrate plus Nitrite (as N), FIL, COL, LL |
| Analyte | Parm-meth Code | Water Year | # of Samples |
25th Pctl | 50th Pctl (Median) |
75th Pctl |
|---|---|---|---|---|---|---|
| Nitrate plus Nitrite (as N), FIL, COL, LL | 00631CL050 | 2008 | 3 | 98.0% | 98.2% | 102.4% |
| 2009 | 115 | 98.7% | 100.1% | 102.0% | ||
| 2010 | 144 | 100.1% | 101.8% | 103.9% | ||
| 2011 | 137 | 97.9% | 100.0% | 101.8% | ||
| 2012 | 4 | 100.0% | 100.8% | 101.6% |
| Hover over boxplot or outliers for additional information |
| Chart generated 01/12/2024 |
| - Nitrate plus Nitrite (as N), FIL, DA - |
| Lab: NWQL, PCode: 00631, MCode: RED01 |
| Analysis Dates: 10/20/11 through 09/20/23 |
| Open Data Set |
| Boxplot Description |
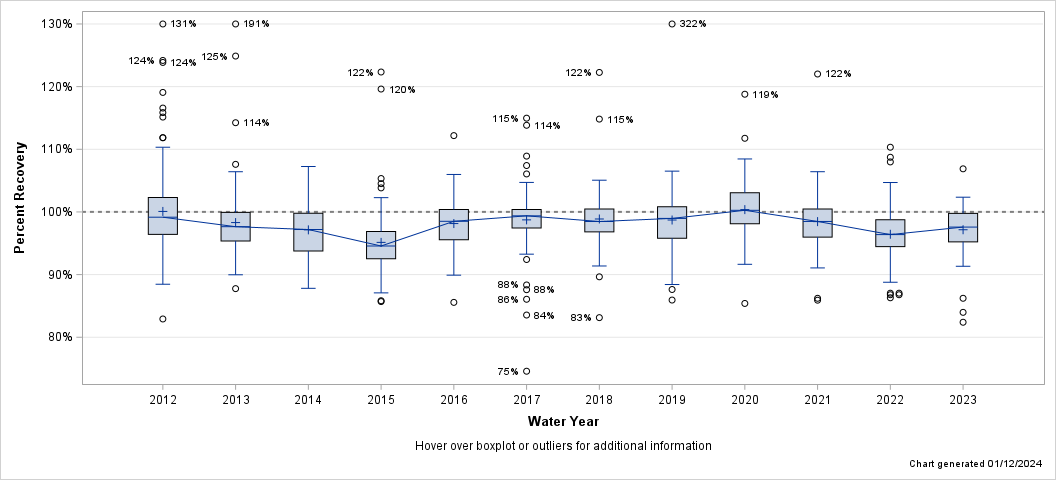
| Percent Recovery Statistics for Nitrate plus Nitrite (as N), FIL, DA |
| Analyte | Parm-meth Code | Water Year | # of Samples |
25th Pctl | 50th Pctl (Median) |
75th Pctl |
|---|---|---|---|---|---|---|
| Nitrate plus Nitrite (as N), FIL, DA | 00631RED01 | 2012 | 140 | 96.4% | 99.2% | 102.3% |
| 2013 | 108 | 95.4% | 97.6% | 99.9% | ||
| 2014 | 88 | 93.8% | 97.2% | 99.8% | ||
| 2015 | 96 | 92.5% | 94.6% | 96.9% | ||
| 2016 | 96 | 95.6% | 98.5% | 100.4% | ||
| 2017 | 87 | 97.4% | 99.4% | 100.4% | ||
| 2018 | 89 | 96.8% | 98.5% | 100.5% | ||
| 2019 | 82 | 95.8% | 99.0% | 100.8% | ||
| 2020 | 95 | 98.1% | 100.3% | 103.1% | ||
| 2021 | 95 | 96.0% | 98.5% | 100.5% | ||
| 2022 | 69 | 94.5% | 96.4% | 98.8% | ||
| 2023 | 79 | 95.2% | 97.6% | 99.8% |
| Hover over boxplot or outliers for additional information |
| Chart generated 01/12/2024 |
| - Nitrate plus Nitrite (as N), FIL, DA, LL - |
| Lab: NWQL, PCode: 00631, MCode: RED02 |
| Analysis Dates: 10/20/11 through 09/28/23 |
| Open Data Set |
| Boxplot Description |
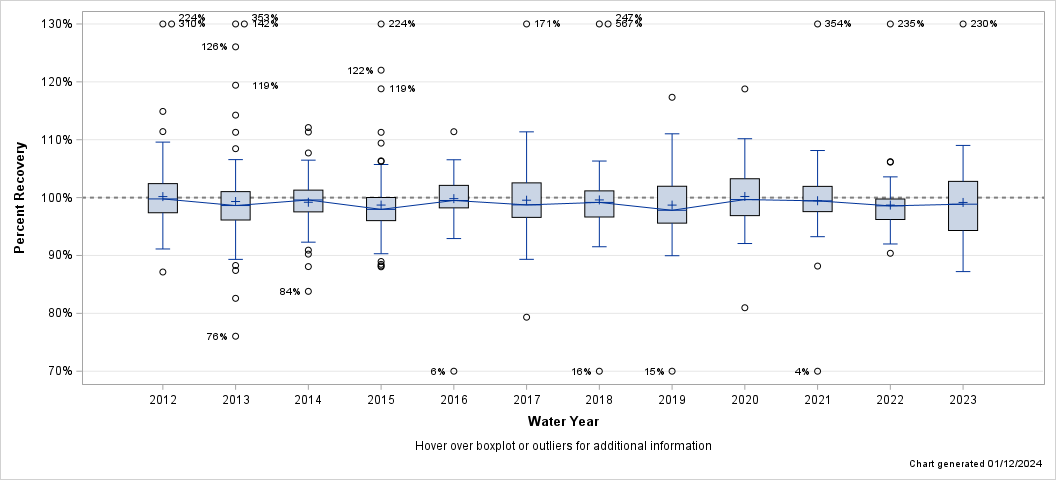
| Percent Recovery Statistics for Nitrate plus Nitrite (as N), FIL, DA, LL |
| Analyte | Parm-meth Code | Water Year | # of Samples |
25th Pctl | 50th Pctl (Median) |
75th Pctl |
|---|---|---|---|---|---|---|
| Nitrate plus Nitrite (as N), FIL, DA, LL | 00631RED02 | 2012 | 140 | 97.4% | 99.8% | 102.4% |
| 2013 | 108 | 96.1% | 98.6% | 101.0% | ||
| 2014 | 90 | 97.5% | 99.6% | 101.3% | ||
| 2015 | 96 | 96.0% | 98.0% | 100.0% | ||
| 2016 | 94 | 98.2% | 99.5% | 102.1% | ||
| 2017 | 90 | 96.6% | 98.7% | 102.5% | ||
| 2018 | 58 | 96.6% | 99.2% | 101.2% | ||
| 2019 | 60 | 95.6% | 97.8% | 102.0% | ||
| 2020 | 65 | 96.9% | 99.7% | 103.3% | ||
| 2021 | 66 | 97.6% | 99.4% | 101.9% | ||
| 2022 | 46 | 96.2% | 98.6% | 99.8% | ||
| 2023 | 63 | 94.3% | 98.9% | 102.8% |
| Hover over boxplot or outliers for additional information |
| Chart generated 01/12/2024 |
| - Orthophosphate (as P), FIL, DA - |
| Lab: NWQL, PCode: 00671, MCode: PHM01 |
| Analysis Dates: 10/01/08 through 09/28/23 |
| Open Data Set |
| Boxplot Description |
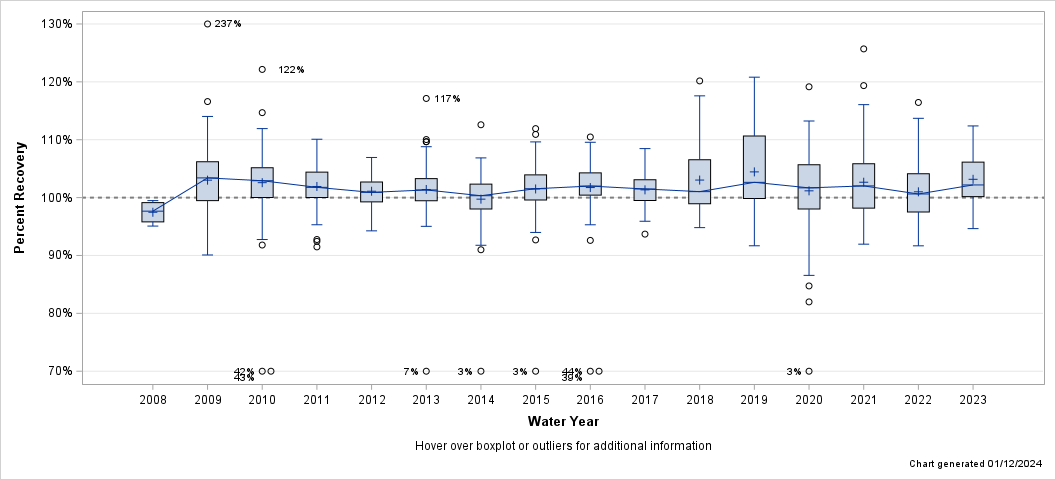
| Percent Recovery Statistics for Orthophosphate (as P), FIL, DA |
| Analyte | Parm-meth Code | Water Year | # of Samples |
25th Pctl | 50th Pctl (Median) |
75th Pctl |
|---|---|---|---|---|---|---|
| Orthophosphate (as P), FIL, DA | 00671PHM01 | 2008 | 4 | 95.8% | 97.7% | 99.1% |
| 2009 | 137 | 99.5% | 103.4% | 106.2% | ||
| 2010 | 144 | 100.0% | 102.9% | 105.2% | ||
| 2011 | 120 | 100.0% | 101.8% | 104.4% | ||
| 2012 | 116 | 99.3% | 100.9% | 102.7% | ||
| 2013 | 108 | 99.5% | 101.3% | 103.3% | ||
| 2014 | 67 | 98.0% | 100.3% | 102.3% | ||
| 2015 | 96 | 99.6% | 101.5% | 103.9% | ||
| 2016 | 96 | 100.4% | 102.0% | 104.3% | ||
| 2017 | 87 | 99.5% | 101.5% | 103.1% | ||
| 2018 | 96 | 98.9% | 101.0% | 106.5% | ||
| 2019 | 82 | 99.9% | 102.6% | 110.6% | ||
| 2020 | 95 | 98.0% | 101.7% | 105.7% | ||
| 2021 | 96 | 98.2% | 102.0% | 105.9% | ||
| 2022 | 91 | 97.5% | 100.6% | 104.1% | ||
| 2023 | 80 | 100.2% | 102.2% | 106.1% |
| Hover over boxplot or outliers for additional information |
| Chart generated 01/12/2024 |
| - Phosphorus (as P), UNF, ASF, Kjeldahl - |
| Lab: NWQL, PCode: 00665, MCode: KJ009 |
| Analysis Dates: 10/01/08 through 09/27/23 |
| Open Data Set |
| Boxplot Description |
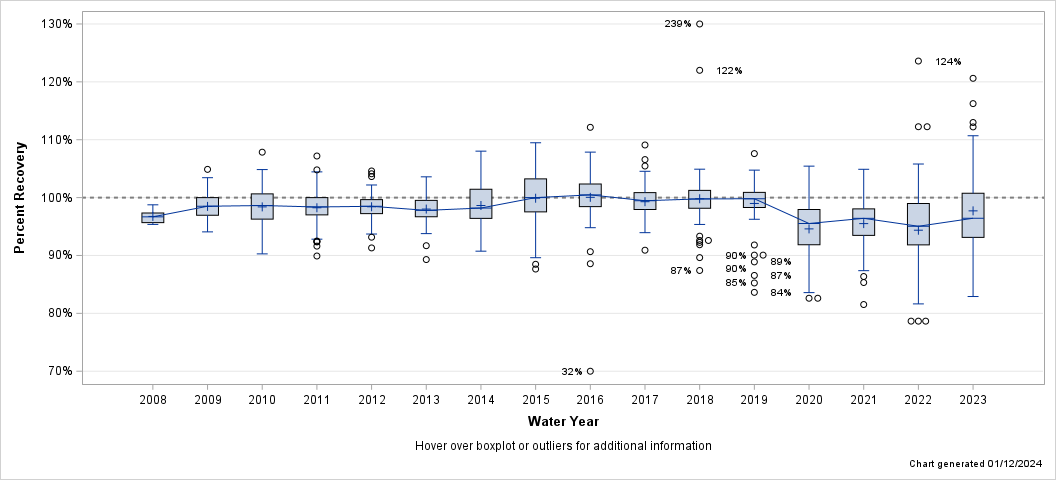
| Percent Recovery Statistics for Phosphorus (as P), UNF, ASF, Kjeldahl |
| Analyte | Parm-meth Code | Water Year | # of Samples |
25th Pctl | 50th Pctl (Median) |
75th Pctl |
|---|---|---|---|---|---|---|
| Phosphorus (as P), UNF, ASF, Kjeldahl | 00665KJ009 | 2008 | 6 | 95.7% | 96.7% | 97.3% |
| 2009 | 136 | 97.0% | 98.5% | 100.0% | ||
| 2010 | 144 | 96.3% | 98.6% | 100.6% | ||
| 2011 | 138 | 97.0% | 98.4% | 100.0% | ||
| 2012 | 134 | 97.2% | 98.5% | 99.6% | ||
| 2013 | 103 | 96.7% | 97.8% | 99.5% | ||
| 2014 | 84 | 96.4% | 98.2% | 101.4% | ||
| 2015 | 90 | 97.5% | 100.0% | 103.2% | ||
| 2016 | 90 | 98.4% | 100.5% | 102.4% | ||
| 2017 | 77 | 98.0% | 99.5% | 100.9% | ||
| 2018 | 90 | 98.2% | 99.8% | 101.2% | ||
| 2019 | 80 | 98.3% | 99.8% | 100.9% | ||
| 2020 | 73 | 91.8% | 95.5% | 97.9% | ||
| 2021 | 74 | 93.5% | 96.4% | 98.0% | ||
| 2022 | 77 | 91.8% | 95.0% | 99.0% | ||
| 2023 | 83 | 93.1% | 96.4% | 100.7% |
| Hover over boxplot or outliers for additional information |
| Chart generated 01/12/2024 |
| - Phosphorus (as P), UNF, CFA, ACD-P, LL - |
| Lab: NWQL, PCode: 00665, MCode: CL021 |
| Analysis Dates: 10/02/08 through 09/20/23 |
| Open Data Set |
| Boxplot Description |
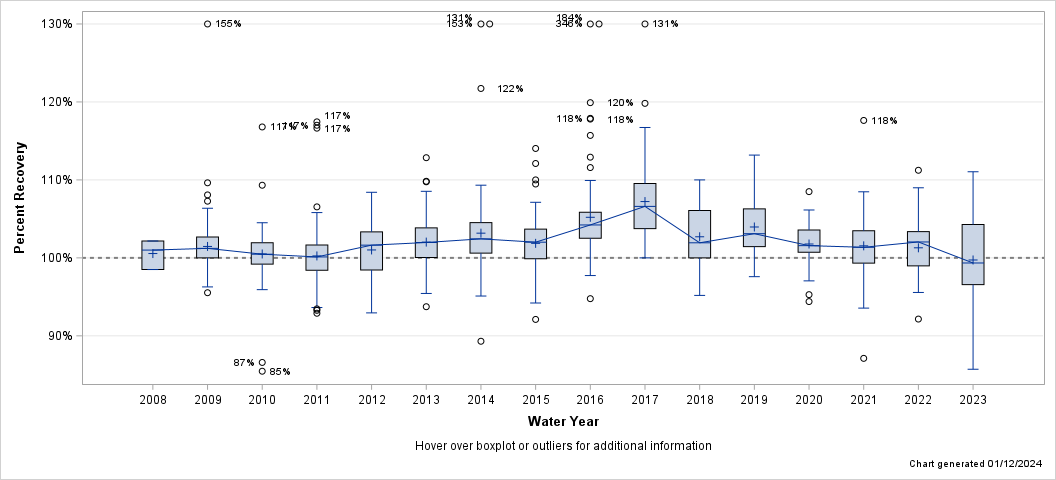
| Percent Recovery Statistics for Phosphorus (as P), UNF, CFA, ACD-P, LL |
| Analyte | Parm-meth Code | Water Year | # of Samples |
25th Pctl | 50th Pctl (Median) |
75th Pctl |
|---|---|---|---|---|---|---|
| Phosphorus (as P), UNF, CFA, ACD-P, LL | 00665CL021 | 2008 | 3 | 98.5% | 101.0% | 102.2% |
| 2009 | 135 | 100.0% | 101.2% | 102.7% | ||
| 2010 | 144 | 99.2% | 100.5% | 101.9% | ||
| 2011 | 144 | 98.4% | 100.1% | 101.7% | ||
| 2012 | 144 | 98.4% | 101.6% | 103.3% | ||
| 2013 | 108 | 100.0% | 102.0% | 103.8% | ||
| 2014 | 90 | 100.6% | 102.4% | 104.5% | ||
| 2015 | 96 | 99.9% | 102.0% | 103.7% | ||
| 2016 | 94 | 102.5% | 104.2% | 105.9% | ||
| 2017 | 90 | 103.8% | 106.6% | 109.5% | ||
| 2018 | 66 | 100.0% | 101.9% | 106.1% | ||
| 2019 | 60 | 101.4% | 103.1% | 106.3% | ||
| 2020 | 65 | 100.7% | 101.6% | 103.6% | ||
| 2021 | 66 | 99.3% | 101.4% | 103.5% | ||
| 2022 | 63 | 99.0% | 102.0% | 103.4% | ||
| 2023 | 58 | 96.6% | 99.3% | 104.3% |
| Hover over boxplot or outliers for additional information |
| Chart generated 01/12/2024 |
| - Phosphorus (as P), UNF, CFA, ALK-P, ACD - |
| Lab: NWQL, PCode: 00665, MCode: AKP01 |
| Analysis Dates: 10/01/08 through 08/08/23 |
| Open Data Set |
| Boxplot Description |
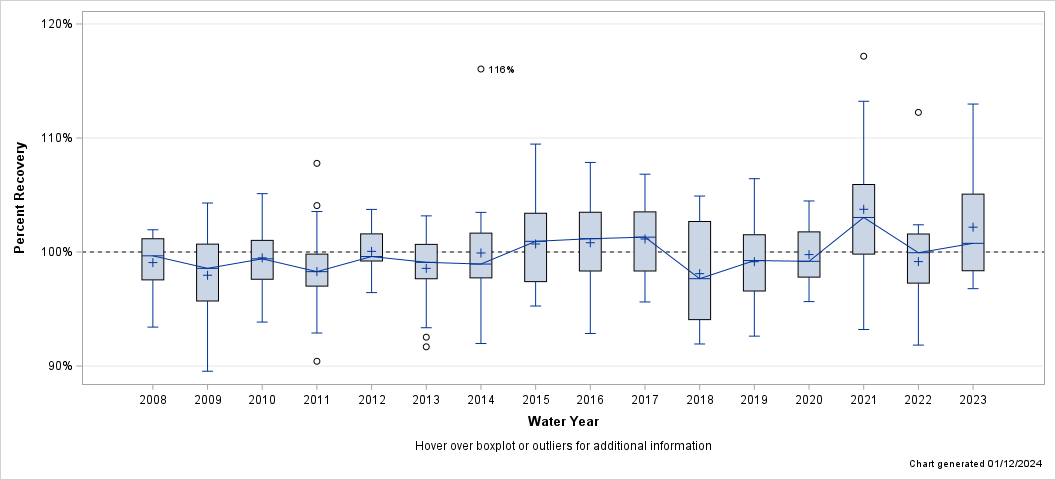
| Percent Recovery Statistics for Phosphorus (as P), UNF, CFA, ALK-P, ACD |
| Analyte | Parm-meth Code | Water Year | # of Samples |
25th Pctl | 50th Pctl (Median) |
75th Pctl |
|---|---|---|---|---|---|---|
| Phosphorus (as P), UNF, CFA, ALK-P, ACD | 00665AKP01 | 2008 | 7 | 97.6% | 99.7% | 101.2% |
| 2009 | 95 | 95.7% | 98.6% | 100.7% | ||
| 2010 | 96 | 97.6% | 99.4% | 101.0% | ||
| 2011 | 81 | 97.0% | 98.3% | 99.8% | ||
| 2012 | 21 | 99.2% | 99.6% | 101.6% | ||
| 2013 | 36 | 97.7% | 99.1% | 100.7% | ||
| 2014 | 23 | 97.7% | 98.9% | 101.7% | ||
| 2015 | 24 | 97.4% | 100.9% | 103.4% | ||
| 2016 | 24 | 98.3% | 101.2% | 103.5% | ||
| 2017 | 24 | 98.3% | 101.3% | 103.5% | ||
| 2018 | 24 | 94.1% | 97.7% | 102.7% | ||
| 2019 | 20 | 96.6% | 99.3% | 101.5% | ||
| 2020 | 24 | 97.8% | 99.2% | 101.8% | ||
| 2021 | 24 | 99.8% | 103.0% | 105.9% | ||
| 2022 | 24 | 97.3% | 99.9% | 101.6% | ||
| 2023 | 15 | 98.4% | 100.8% | 105.1% |
| Hover over boxplot or outliers for additional information |
| Chart generated 01/12/2024 |
| - Phosphorus as P, FIL, ASF, Kjeldahl - |
| Lab: NWQL, PCode: 00666, MCode: KJ005 |
| Analysis Dates: 10/01/08 through 09/26/23 |
| Open Data Set |
| Boxplot Description |
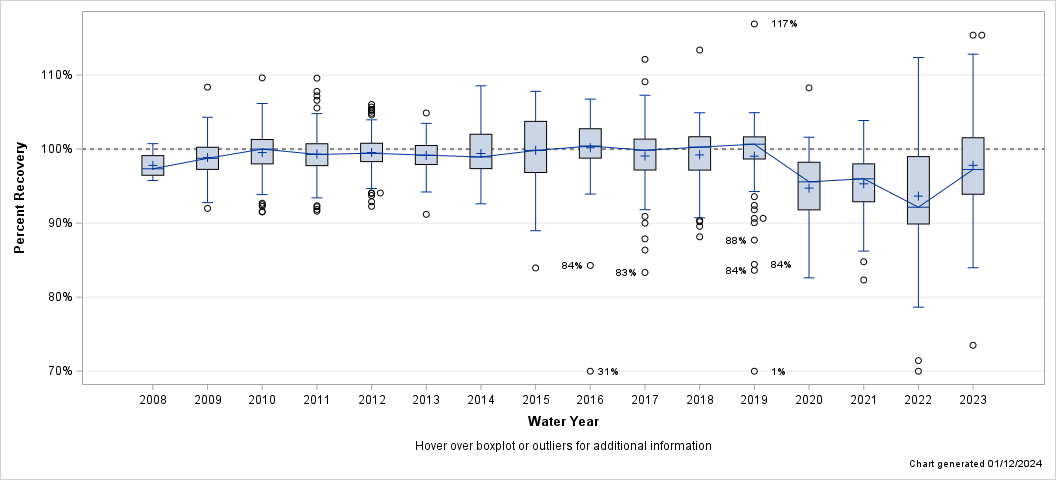
| Percent Recovery Statistics for Phosphorus as P, FIL, ASF, Kjeldahl |
| Analyte | Parm-meth Code | Water Year | # of Samples |
25th Pctl | 50th Pctl (Median) |
75th Pctl |
|---|---|---|---|---|---|---|
| Phosphorus as P, FIL, ASF, Kjeldahl | 00666KJ005 | 2008 | 4 | 96.5% | 97.3% | 99.1% |
| 2009 | 136 | 97.3% | 98.8% | 100.2% | ||
| 2010 | 144 | 98.0% | 100.0% | 101.3% | ||
| 2011 | 138 | 97.8% | 99.3% | 100.7% | ||
| 2012 | 134 | 98.3% | 99.4% | 100.8% | ||
| 2013 | 103 | 97.9% | 99.2% | 100.5% | ||
| 2014 | 84 | 97.4% | 98.9% | 102.0% | ||
| 2015 | 90 | 96.8% | 99.8% | 103.7% | ||
| 2016 | 90 | 98.8% | 100.4% | 102.7% | ||
| 2017 | 77 | 97.2% | 99.8% | 101.4% | ||
| 2018 | 90 | 97.2% | 100.3% | 101.7% | ||
| 2019 | 80 | 98.7% | 100.7% | 101.7% | ||
| 2020 | 74 | 91.8% | 95.6% | 98.2% | ||
| 2021 | 74 | 92.9% | 96.0% | 98.0% | ||
| 2022 | 74 | 89.9% | 92.2% | 99.0% | ||
| 2023 | 82 | 93.9% | 97.2% | 101.5% |
| Hover over boxplot or outliers for additional information |
| Chart generated 01/12/2024 |
| - Phosphorus as P, FIL, CFA, ACD, LL - |
| Lab: NWQL, PCode: 00666, MCode: CL019 |
| Analysis Dates: 10/22/08 through 10/07/11 |
| Open Data Set |
| Boxplot Description |
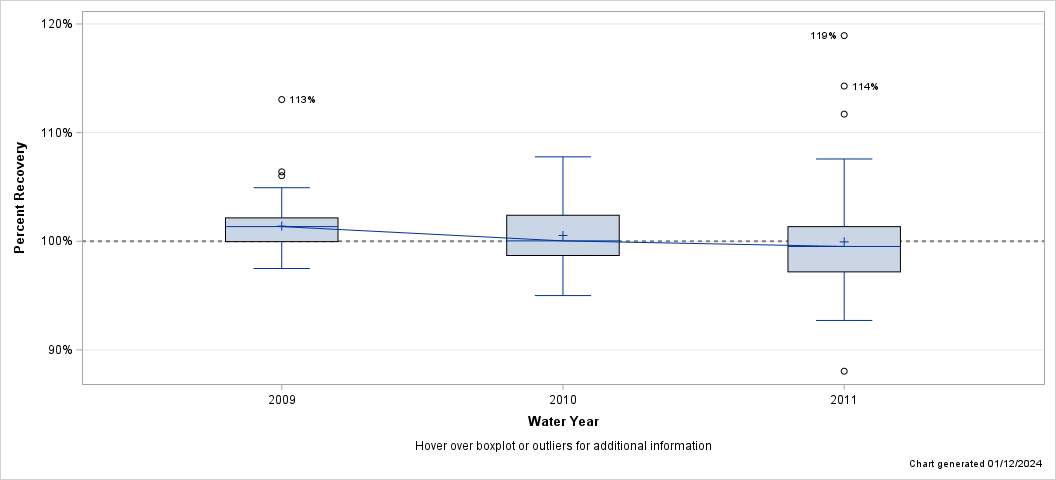
| Percent Recovery Statistics for Phosphorus as P, FIL, CFA, ACD, LL |
| Analyte | Parm-meth Code | Water Year | # of Samples |
25th Pctl | 50th Pctl (Median) |
75th Pctl |
|---|---|---|---|---|---|---|
| Phosphorus as P, FIL, CFA, ACD, LL | 00666CL019 | 2009 | 54 | 100.0% | 101.3% | 102.1% |
| 2010 | 59 | 98.7% | 100.0% | 102.4% | ||
| 2011 | 60 | 97.2% | 99.5% | 101.3% |
| Hover over boxplot or outliers for additional information |
| Chart generated 01/12/2024 |
| - Phosphorus as P, FIL, CFA, ACD-P, LL - |
| Lab: NWQL, PCode: 00666, MCode: CL020 |
| Analysis Dates: 10/16/08 through 09/28/23 |
| Open Data Set |
| Boxplot Description |
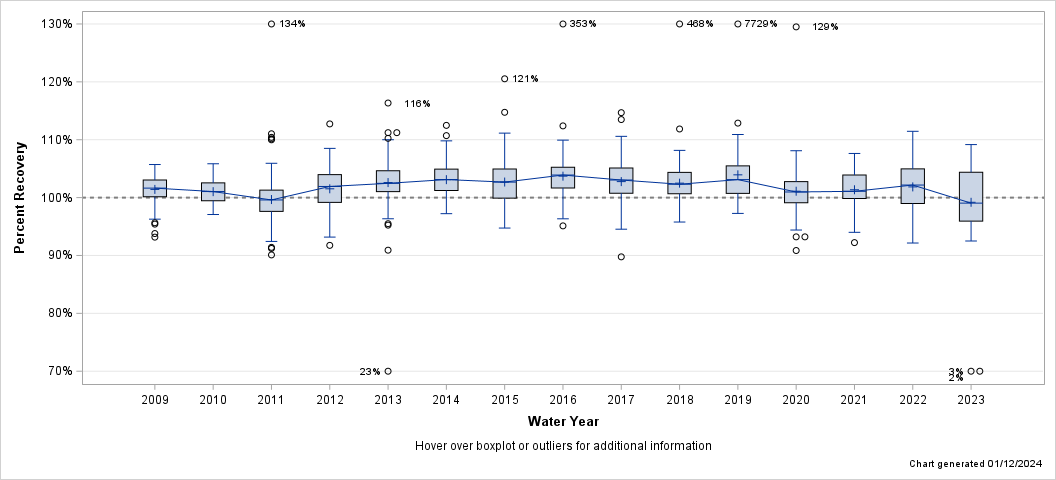
| Percent Recovery Statistics for Phosphorus as P, FIL, CFA, ACD-P, LL |
| Analyte | Parm-meth Code | Water Year | # of Samples |
25th Pctl | 50th Pctl (Median) |
75th Pctl |
|---|---|---|---|---|---|---|
| Phosphorus as P, FIL, CFA, ACD-P, LL | 00666CL020 | 2009 | 127 | 100.2% | 101.6% | 103.0% |
| 2010 | 143 | 99.5% | 101.0% | 102.5% | ||
| 2011 | 144 | 97.6% | 99.6% | 101.3% | ||
| 2012 | 144 | 99.2% | 101.9% | 104.0% | ||
| 2013 | 108 | 101.0% | 102.5% | 104.6% | ||
| 2014 | 90 | 101.2% | 103.1% | 104.9% | ||
| 2015 | 96 | 99.9% | 102.7% | 104.9% | ||
| 2016 | 94 | 101.7% | 103.9% | 105.2% | ||
| 2017 | 90 | 100.8% | 103.0% | 105.1% | ||
| 2018 | 66 | 100.7% | 102.3% | 104.4% | ||
| 2019 | 60 | 100.7% | 103.1% | 105.5% | ||
| 2020 | 65 | 99.1% | 101.0% | 102.8% | ||
| 2021 | 66 | 99.8% | 101.1% | 103.9% | ||
| 2022 | 64 | 99.0% | 102.2% | 105.0% | ||
| 2023 | 60 | 95.9% | 99.0% | 104.4% |
| Hover over boxplot or outliers for additional information |
| Chart generated 01/12/2024 |
| - Phosphorus as P, FIL, CFA, ALK-P - |
| Lab: NWQL, PCode: 00666, MCode: CL063 |
| Analysis Dates: 10/02/08 through 09/01/23 |
| Open Data Set |
| Boxplot Description |
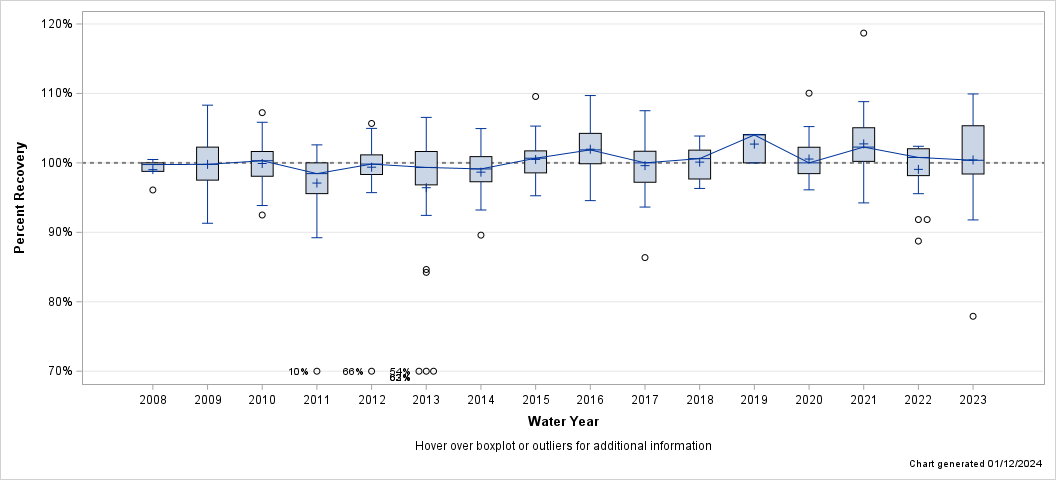
| Percent Recovery Statistics for Phosphorus as P, FIL, CFA, ALK-P |
| Analyte | Parm-meth Code | Water Year | # of Samples |
25th Pctl | 50th Pctl (Median) |
75th Pctl |
|---|---|---|---|---|---|---|
| Phosphorus as P, FIL, CFA, ALK-P | 00666CL063 | 2008 | 5 | 98.8% | 99.8% | 100.0% |
| 2009 | 52 | 97.5% | 99.8% | 102.3% | ||
| 2010 | 49 | 98.1% | 100.3% | 101.6% | ||
| 2011 | 48 | 95.6% | 98.5% | 100.0% | ||
| 2012 | 48 | 98.3% | 99.8% | 101.1% | ||
| 2013 | 36 | 96.8% | 99.3% | 101.6% | ||
| 2014 | 23 | 97.3% | 99.1% | 100.9% | ||
| 2015 | 24 | 98.6% | 100.7% | 101.7% | ||
| 2016 | 24 | 99.9% | 101.9% | 104.3% | ||
| 2017 | 24 | 97.2% | 100.0% | 101.7% | ||
| 2018 | 14 | 97.7% | 100.6% | 101.8% | ||
| 2019 | 3 | 100.0% | 104.0% | 104.1% | ||
| 2020 | 24 | 98.5% | 100.0% | 102.2% | ||
| 2021 | 24 | 100.2% | 102.3% | 105.1% | ||
| 2022 | 24 | 98.2% | 100.8% | 102.0% | ||
| 2023 | 16 | 98.4% | 100.4% | 105.3% |
| Hover over boxplot or outliers for additional information |
| Chart generated 01/12/2024 |
| - Phosphorus as P, FIL, CFA, ALK-P, ACD - |
| Lab: NWQL, PCode: 00666, MCode: CL062 |
| Analysis Dates: 12/31/08 through 05/20/09 |
| Open Data Set |
| Boxplot Description |
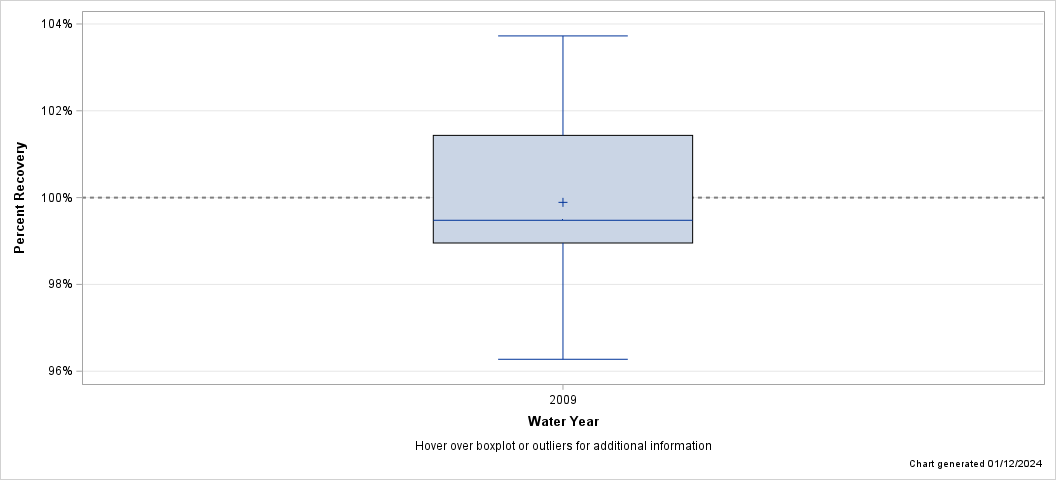
| Percent Recovery Statistics for Phosphorus as P, FIL, CFA, ALK-P, ACD |
| Analyte | Parm-meth Code | Water Year | # of Samples |
25th Pctl | 50th Pctl (Median) |
75th Pctl |
|---|---|---|---|---|---|---|
| Phosphorus as P, FIL, CFA, ALK-P, ACD | 00666CL062 | 2009 | 6 | 99.0% | 99.5% | 101.4% |
| Hover over boxplot or outliers for additional information |
| Chart generated 01/12/2024 |
| - Total Nitrogen (NH3+NO3+NO2 plus org N), FIL, CFA, ALK-P - |
| Lab: NWQL, PCode: 62854, MCode: CL063 |
| Analysis Dates: 10/02/08 through 09/01/23 |
| Open Data Set |
| Boxplot Description |
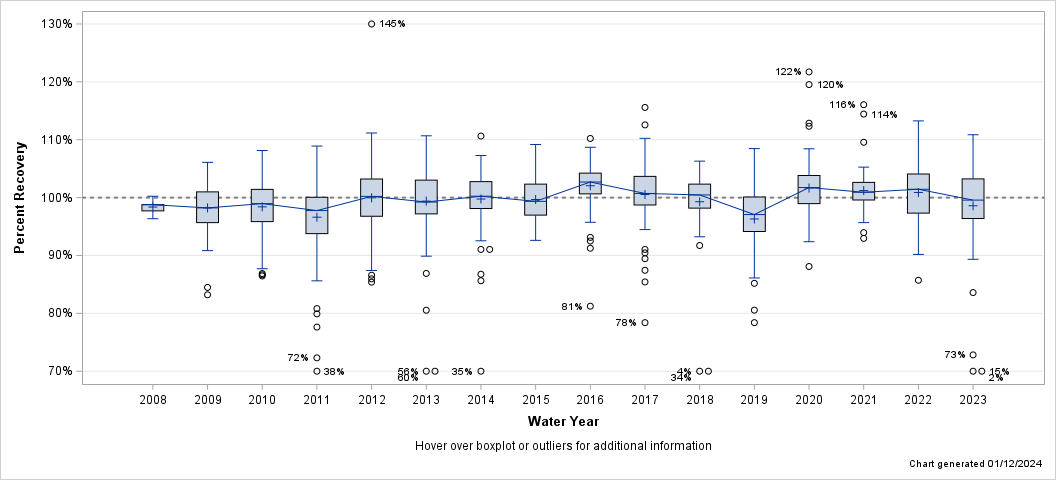
| Percent Recovery Statistics for Total Nitrogen (NH3+NO3+NO2 plus org N), FIL, CFA, ALK-P |
| Analyte | Parm-meth Code | Water Year | # of Samples |
25th Pctl | 50th Pctl (Median) |
75th Pctl |
|---|---|---|---|---|---|---|
| Total Nitrogen (NH3+NO3+NO2 plus org N), FIL, CFA, ALK-P | 62854CL063 | 2008 | 5 | 97.7% | 98.8% | 98.8% |
| 2009 | 137 | 95.7% | 98.2% | 101.0% | ||
| 2010 | 144 | 95.9% | 99.0% | 101.4% | ||
| 2011 | 140 | 93.8% | 97.8% | 100.1% | ||
| 2012 | 144 | 96.8% | 100.2% | 103.2% | ||
| 2013 | 108 | 97.2% | 99.2% | 103.0% | ||
| 2014 | 90 | 98.1% | 100.2% | 102.8% | ||
| 2015 | 72 | 97.0% | 99.4% | 102.3% | ||
| 2016 | 72 | 100.6% | 102.7% | 104.2% | ||
| 2017 | 71 | 98.7% | 100.7% | 103.7% | ||
| 2018 | 72 | 98.2% | 100.5% | 102.3% | ||
| 2019 | 61 | 94.1% | 97.1% | 100.1% | ||
| 2020 | 71 | 99.0% | 101.7% | 103.8% | ||
| 2021 | 72 | 99.6% | 100.9% | 102.6% | ||
| 2022 | 82 | 97.3% | 101.4% | 104.1% | ||
| 2023 | 68 | 96.4% | 99.6% | 103.2% |
| Hover over boxplot or outliers for additional information |
| Chart generated 01/12/2024 |
| - Total Nitrogen (NH3+NO3+NO2+org N), UNF, CFA, ALK-P, ACD - |
| Lab: NWQL, PCode: 62855, MCode: AKP01 |
| Analysis Dates: 10/01/08 through 08/10/23 |
| Open Data Set |
| Boxplot Description |
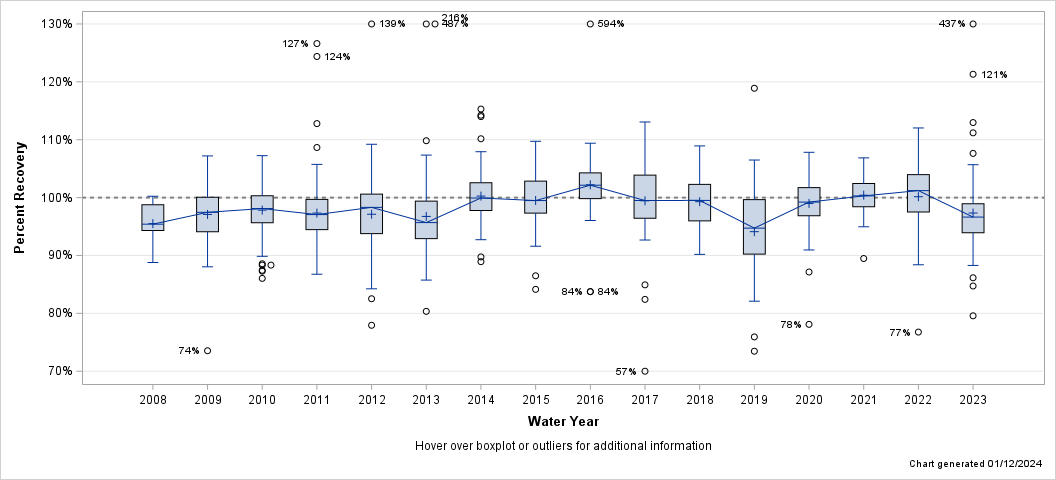
| Percent Recovery Statistics for Total Nitrogen (NH3+NO3+NO2+org N), UNF, CFA, ALK-P, ACD |
| Analyte | Parm-meth Code | Water Year | # of Samples |
25th Pctl | 50th Pctl (Median) |
75th Pctl |
|---|---|---|---|---|---|---|
| Total Nitrogen (NH3+NO3+NO2+org N), UNF, CFA, ALK-P, ACD | 62855AKP01 | 2008 | 5 | 94.3% | 95.4% | 98.8% |
| 2009 | 133 | 94.1% | 97.5% | 100.1% | ||
| 2010 | 144 | 95.7% | 98.1% | 100.3% | ||
| 2011 | 144 | 94.5% | 97.1% | 99.7% | ||
| 2012 | 144 | 93.8% | 98.3% | 100.6% | ||
| 2013 | 108 | 92.9% | 95.7% | 99.4% | ||
| 2014 | 90 | 97.8% | 99.9% | 102.6% | ||
| 2015 | 72 | 97.3% | 99.5% | 102.8% | ||
| 2016 | 72 | 99.8% | 102.1% | 104.3% | ||
| 2017 | 71 | 96.4% | 99.5% | 103.9% | ||
| 2018 | 72 | 96.0% | 99.5% | 102.3% | ||
| 2019 | 61 | 90.2% | 94.7% | 99.6% | ||
| 2020 | 71 | 96.9% | 99.2% | 101.7% | ||
| 2021 | 72 | 98.4% | 100.3% | 102.4% | ||
| 2022 | 82 | 97.5% | 101.2% | 104.0% | ||
| 2023 | 64 | 93.9% | 96.6% | 98.9% |
| Hover over boxplot or outliers for additional information |
| Chart generated 01/12/2024 |